In this series 100 years of Market Cycles, we will show investors over the coming issues all of the Bull Market and Bear Market cycles that occurred over the last hundred years.
In this months issue we look at the 1915-1916 Bull Market and we also look at the 1917 bear market that followed the bull market.
By studying these market cycles investors gain an appreciation of how the stock market moves forward over time. These market cycles lead to good times that are followed by bad times and in turn these bad times are followed by good times. This cyclical nature is the driving force behind the stock market.
The Dow Industrials Average
The Dow Industrials Average was originally formed in 1896 with just 12 stocks. This was increased to 20 stocks in 1916 and in 1928 was again increased to 30 stocks – which is the number of stocks used today..
For the analysis of market cycles that occurred prior to 1957 (when the S&P 500 index was formed) we will use the Dow Industrial as this was the market index that was used prior to 1957.
The stock market is best viewed with a long-term perspective as this puts the stock markets current performance into the right context.
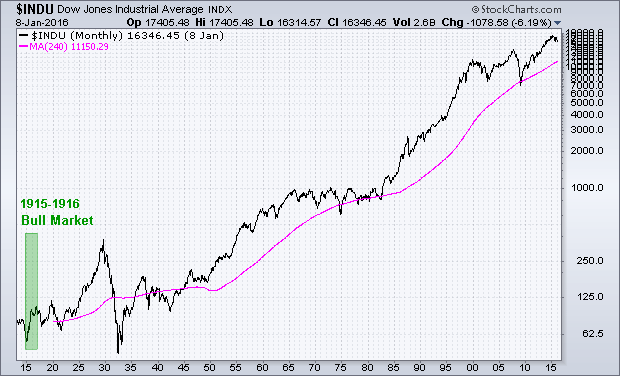
The following chart shows the 1915-1916 bull market on a 100-year chart of the Dow Industrials.
Chart 1. History of the Dow Industrials

Chart by stockcharts.com
The long-term monthly line chart shown above for the Dow Industrials visually displays the stock markets behavior over the last 100 years. The 1915-1916 bull market is highlighted in green and the chart shows how this bull market cycle slots into the long-term picture.
The upward trending nature of the stock market can be readily observed with the Dow Industrials broadly traveling upwards in a zig-zag like manner with frequent market corrections, numerous minor bear markets and the occasional severe bear market. These market corrections can last for many months and the bear markets can last for a year or two and sometimes three.
Bull markets and bear markets along with the less severe market corrections are a normal function of the stock market. To reassure investors, the long-term direction of the stock market is upwards inline with the general expansion of the economy over the long-term.
The 1915-1916 Bull Market in Detail
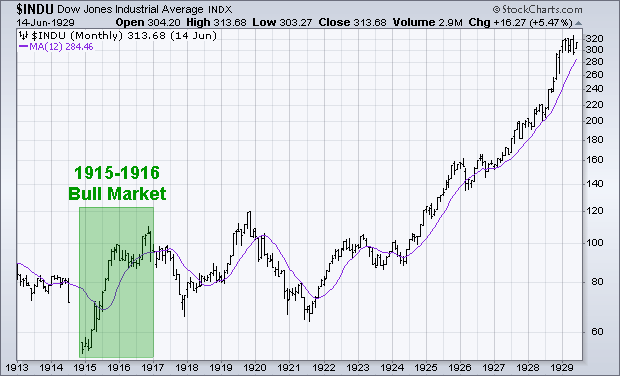
The 1915-1916 bull market can be viewed in more detail with a 20-year monthly bar chart as shown below.
Chart 2. Dow Industrials Monthly Chart

Chart by stockcharts.com
The above chart shows how the 1915-1916 bull market traded.
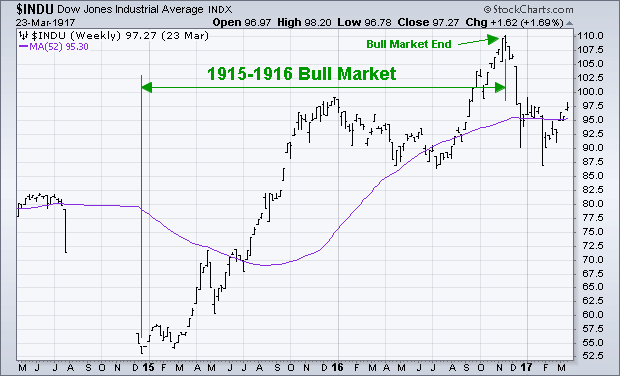
The 1915-1916 bull market is shown again with a 2-year weekly bar chart which provides more detail on how the stock market moved through its bull market cycle.
Chart 3. Dow Industrials Weekly Chart

Chart by stockcharts.com
The above weekly chart shows that the stock market does not go up in a straight smooth line but that the upward journey is actually quite a bumpy ride. This is normal market behavior and occurs all the time.
The 1915-1916 bull market started in December 1914 and lasted for nearly two years with the Dow Industrials gaining around 110%. The bull market started after the stock market was closed for four months during World War 1.
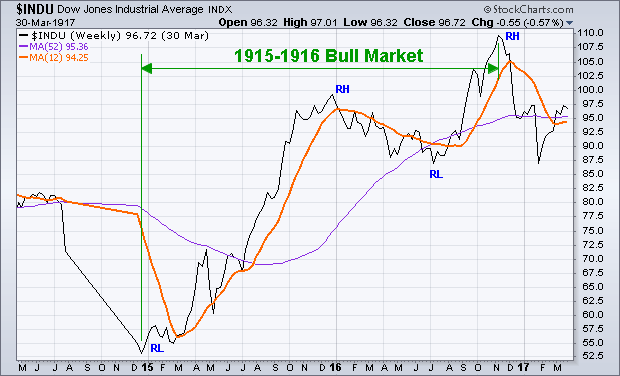
The weekly chart is shown again as a line chart together with a 12-week moving average.
Chart 4. Dow Industrials Highs and Lows

Chart by stockcharts.com
Previous bear markets can end suddenly and the next bull market begins. To help identify when a new bull market has begun, investors can use the principle of Relative Highs and Lows. The 12-week moving average aids in highlighting these Relative Highs and Lows.
From the above line-chart, the December 1914 RL (Relative Low) marks the start of the bull market. The bull market progresses as each consecutive RH (Relative High) is generally higher than the preceding RH. Similarly each RL is generally higher than the preceding RL. This higher RH and higher RL is typical bull market behavior.
The 1917 bear market followed the 1915-1916 bull market.
